

By: Ron Pernick

Quarterly overview of stock index performance and the top trends impacting the state of clean tech.
“The future is already here – it’s just not evenly distributed,” is the oft-quoted dictum attributed to sci-fi author William Gibson. This certainly reflects the shift from fossil fuels to clean energy – where some places are far ahead of the energy transition curve. Last year, for example, Germany and Spain reached 52% and 50% of their electricity generation from renewable energy (RE) sources, respectively, a record for both. For six consecutive days in October, Portugal was fully powered by RE on its grid, and RE accounted for 61% of the country's electricity generation in 2023, up from 49% a year earlier. We see similar energy transition milestones in transportation; more than half of all passenger cars sold in countries like Norway, Iceland, and Sweden are now electric vehicles (EVs), while China is projected to see one-third of all car sales attributed to EVs for its final 2023 tally. China-based BYD surpassed Tesla for the first time in EVs shipped in a full quarter (Q4 2023), and China now sells more EVs domestically than any other nation, accounting for approximately 55% of the total global market share. These forward-leaning places provide a glimpse of where things are headed. What’s driving all this activity? As I highlight in my Insight at the end of this column, there are three major trends to watch in the coming year that are poised to reshape our energy landscape:
- A commitment by nearly 200 nations to triple global renewables deployment by 2030
- The massive build-out of new storage and grid infrastructure to support the energy transition, and
- Competition across the globe to deliver a fast-charging, long-range $25,000 EV
As of December 29, 2023 (Total Return) | CELS™ (U.S. Clean Energy) | GWE™ (Global Wind) | HHO™ (U.S. Water) | QGRD™ (Global Grid) | S&P 500 | IXE (Energy Select) |
|---|---|---|---|---|---|---|
Q4 | -0.86% | 14.03% | 15.11% | 11.91% | 11.69% | -6.35% |
12-Month | -9.91% | -2.11% | 21.10% | 22.46% | 26.29% | -0.59% |
Against this backdrop, infrastructure-focused QGRD™ (global smart grid & grid infrastructure) and HHO™ (U.S. water) were the top performers among our four key indexes, up 22.46% and 21.10%, respectively, in 2023. Over the 12-month period, GWE™ (global wind) was down 2.11%, while CELS™ (U.S. clean energy) declined 9.91%. IXE (Energy Select, which benchmarks oil and gas) declined 0.59%, and the S&P 500 increased 26.29% for the full year on a total return basis.
2023 Full Year Index Performance (Total Return)

In Q4 2023, on a total return basis, HHO, GWE, and QGRD were up 15.11%, 14.03%, and 11.91%, respectively, all outperforming the S&P 500’s 11.69% increase. CELS declined 0.86% for the quarter, while IXE was down 6.35%.
Q4 2023 Index Performance (Total Return)
First Trust ETFs and UCITS tracking Nasdaq Clean Edge indexes equaled more than $3.5 billion in assets under management as of January 9, 2024.
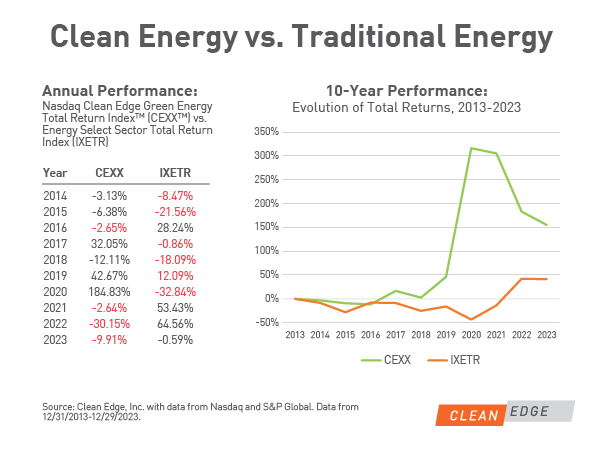
DATA DIVE: CLEAN ENERGY OUTPERFORMS TRADITIONAL ENERGY (CEXX VS IXETR) OVER THE PAST DECADE
Over the past decade, the global economy has made dramatic strides in the expansion of clean energy sources such as solar and wind, the advancement of energy storage, and the deployment of electric-powered transportation. Despite market headwinds from post-Covid supply chain challenges and high interest rates, particularly in offshore wind, renewables continue to be the world’s fastest-growing energy sources and account for the vast majority of new electricity capacity additions globally. More than $1.7 trillion was invested globally in clean energy (including renewable power, grids, storage, low-emission fuels, efficiency improvements, and end-use renewables and electrification) in 2023 compared to slightly more than $1 trillion in coal, gas, and oil, according to International Energy Association (IEA) projections. In other words, for every dollar spent on fossil fuels, $1.70 is now spent on clean energy, according to the IEA. For investors, clean energy has outperformed fossil fuels over the past decade. The Nasdaq Clean Edge Green Energy Total Return™ Index (CEXX™) grew 155.10%, compared to 41.25% growth for IXETR (the Energy Select Sector Total Return Index of S&P 500 companies involved in the development or production of energy, namely oil and gas). Despite three consecutive years of recent losses, CEXX has outperformed IXETR for six of the last 10 years.
DATA DIVE: GRID INFRASTRUCTURE (QGDX) KEY TO RENEWABLES BUILDOUT
As the backbone of the energy transition, the global smart grid and grid infrastructure sector has become an increasing focus of utilities, corporations, governments, and investors. Over the past 10 years, reflecting this trend, the Nasdaq OMX Clean Edge Smart Grid Infrastructure Total Return™ Index (QGDX™) increased 251.07%. During the same period, the Nasdaq Global Total Return™ Index (NQGIT™), designed to track the performance of global equities covering more than 98% of the entire listed market capitalization of the global equity space, rose 121.49%. QGDX outperformed NQGIT in six of the past 10 years (and last year, the spread was a mere 0.02%). The recent pledge by nearly 200 nations at COP28 in Dubai to triple global renewables deployment and double energy efficiency efforts by 2030 – along with broader decarbonization trends such as the electrification of heat, transportation, and industry – will only increase the focus on grid modernization. A record 500 GW of renewable energy capacity was added globally in 2023, up from 300 GW in 2022, according to energy think tank Ember. Ember projects that global renewable capacity will need to increase 17% annually to triple by 2030. Modernized, intelligent grids will be central to the transmission, distribution, management, and storage of all this new clean electricity.

WINNERS AND LOSERS (INDEX CONSTITUENTS RANKED BY PRICE RETURN)
Below is a list of the top 10 best and worst constituent performers across all six Nasdaq Clean Edge Nasdaq indexes during 2023.
Best and Worst Constituents (2023)
Winners | Losers | ||
|---|---|---|---|
Fortune Electric Co., Ltd. | 578.01% | Li-Cycle Holdings Corp. | -87.71% |
Ecopro Co., Ltd. | 516.74% | ChargePoint Holdings, Inc. | -75.45% |
Hammond Power Solutions, Inc. | 317.26% | FTC Solar, Inc. | -74.15% |
NVIDIA Corporation | 238.87% | SunPower Corporation | -73.21% |
Ecopro BM Co., Ltd. | 207.02% | Blink Charging Co. | -69.10% |
American Superconductor Corporation | 202.72% | Aker Horizons ASA | -67.23% |
Allis Electric Co., Ltd. | 163.94% | SolarEdge Technologies, Inc. | -66.96% |
Navitas Semiconductor Corporation | 129.91% | Plug Power, Inc. | -63.62% |
Core & Main, Inc. | 109.27% | Orron Energy AB | -63.36% |
Iljin Electric Co., Ltd | 106.23% | Ebusco Holding N.V. | -62.34% |
QUARTERLY INSIGHT: THREE MAJOR TRENDS TO WATCH IN 2024
Each year the team at Clean Edge assesses the biggest macro trends impacting the clean-tech ecosystem and technology deployment. Below are three major trends that we believe will reshape the clean-tech ecosystem in the coming year and beyond.
Tripling Renewables & Doubling Efficiency by 2030 is a Game Changer (Targets Make a Difference)
Years from now, when historians look back at the outcome of the COP28 summit in Dubai, they will almost certainly point to the commitment by nearly 200 nations to triple global deployment of renewable energy (RE) and to double energy efficiency efforts by 2030. I see this development as akin to the renewable portfolio standards that fueled the adoption of solar and wind in U.S. states during the late 2000s and throughout the 2010s. The target to triple renewables by 2030, if met, will result in the addition of an astounding 7 terawatts of new renewables over the next 6-7 years (the world currently has about 3.6 terawatts of RE, which has been deployed over several decades). According to an analysis by Bloomberg NEF, this level of new deployment would cut emissions by more than 9 billion tons in 2030, equivalent to a quarter of all global CO2 emissions in 2022. And it’s not just RE; we will also see the aggressive build-out of energy efficiency efforts spanning EVs, heat pumps, building insulation, energy management systems, LEDs, advanced semiconductors, and more. This commitment represents a major tipping point on the road to the energy transition. And while ambitious, it is doable primarily with existing technologies.
Storage & Grids Take Center Stage (Can't Meet RE Targets Without Upgraded T&D)
For decades, U.S. regulators and utilities have deployed energy efficiency measures to keep power demand flat. But as we electrify both transportation and heat, look to integrate mass deployment of renewables, and work to serve energy-hungry data centers powering the AI boom, the era of flat growth is officially over. In its place, we’ll see the birth of a modern, two-way, intelligent, clean-energy grid. But it will take a lot of work and investment to deploy the required transmission and distribution (T&D) infrastructure. Some analysts project that we’ll need $1 dollar of grid investment for every $1 invested in renewables. Indeed, across the globe, nations need to both upgrade their grid infrastructure and deploy more energy storage to keep grids stable as more variable sources like solar and wind come online. According to Paula Mints, long-time solar analyst and head of SPV Market Research, "A future where renewable energy technologies fulfill most (or all) of demand for electricity and heat calls for a complete revamping of utility business models, the energy infrastructure, laws, expectations, and technologies." From virtual power plants and long-duration storage to bi-directional grids and high-voltage direct-current (HVDC) transmission lines, the shift from fossil fuels to clean electricity represents one of the greatest industrial shifts ever embarked upon. One of the most vexing problems right now is that solar and wind projects across the U.S., Europe, Asia, and elsewhere often must wait years in the “interconnection queue” before getting approval to be brought online. This lack of transmission infrastructure is one of the biggest gating factors to increased deployment – and will require collaboration and innovation across technology, policy, and capital. Ideas gaining traction include reconductoring existing transmission lines with advanced conductors to carry more power efficiently and with less loss; burying HVDC lines along current rights of way such as train tracks and interstate highways; and converting shuttered coal plants to solar and storage and leveraging their existing transmission lines to deliver electricity to population centers.
Competition Heats up to Deliver Long-Promised $25,000 EV (I Want One)
Don’t pay attention to all the EV naysaying. Contrary to media reporting, EVs are on a tear. In fact, while just 1 in 20 cars sold worldwide in 2020 were EVs, that number increased to nearly 1 in 5 cars sold in 2023 (that’s more than 14 million electric vehicles sold globally). But to keep such momentum going, prices need to come down. Whether it’s China, Tesla, or a breakout conventional auto player (eyes on Kia), someone is going to finally figure out how to crack the $25,000 EV nut (OK, it might cost closer to $30,000). Elon Musk wasn’t wrong when he touted the concept, and China’s BYD is getting awfully close, but whoever can deliver a globally available mass-market vehicle – featuring fast charging, 300+ range, and top safety and entertainment features all in a $25Kish package – will be the next company to dominate the global automotive market.
Disclaimer:
Nasdaq® is a registered trademark of Nasdaq, Inc. and Clean Edge® is a registered trademark of Clean Edge, Inc. The information contained above is provided for informational and educational purposes only, and nothing contained herein should be construed as investment advice, either on behalf of a particular security or an overall investment strategy. Neither Nasdaq, Inc. nor Clean Edge, Inc. nor any of its affiliates makes any recommendation to buy or sell any security or any representation about the financial condition of any company. Statements regarding Nasdaq-listed or other publicly listed companies or Nasdaq Clean Edge proprietary indexes are not guarantees of future performance. Actual results may differ materially from those expressed or implied. Past performance is not indicative of future results. Investors should undertake their own due diligence and carefully evaluate companies before investing. ADVICE FROM A SECURITIES PROFESSIONAL IS STRONGLY ADVISED.